Exotic plugins
These chart types are not part of Chart.js core. Each is brought in by a dedicated plugin, all bundled with chartjs2img. Every example below shows the rendered PNG, the JSON config, and a ready-to-run CLI / HTTP snippet — flip between tabs to see each.
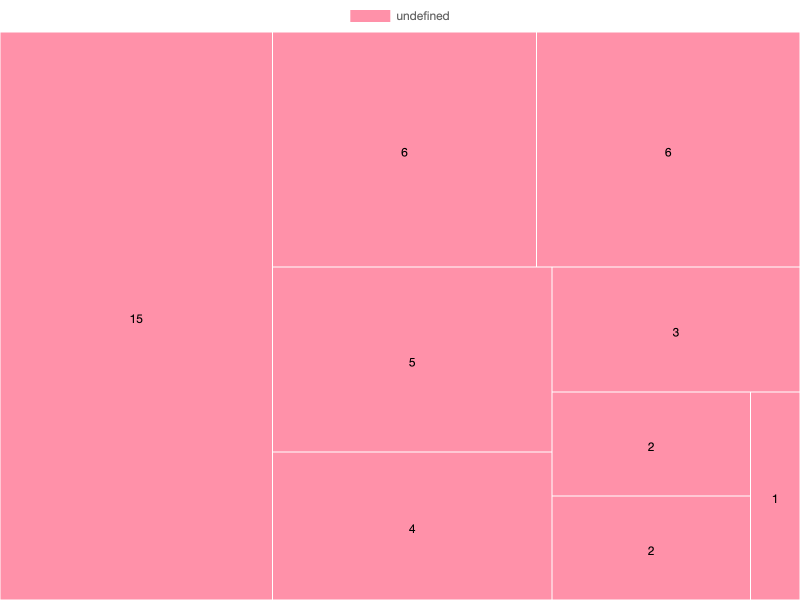
Treemap (chartjs-chart-treemap)
Hierarchical blocks, sized by the tree values of each node.
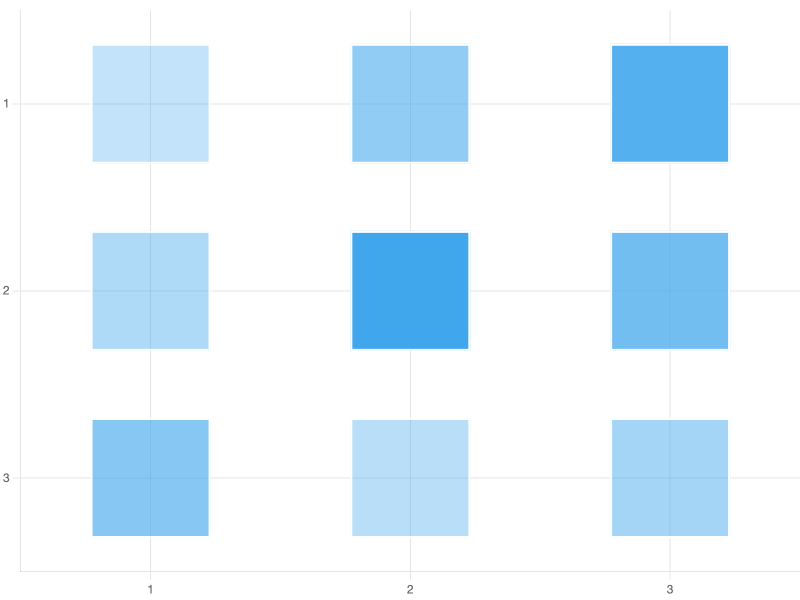
Matrix / heatmap (chartjs-chart-matrix)
Discrete cell grid with per-cell color. JSON can't express a value-to-color function, so pre-compute one color per cell.
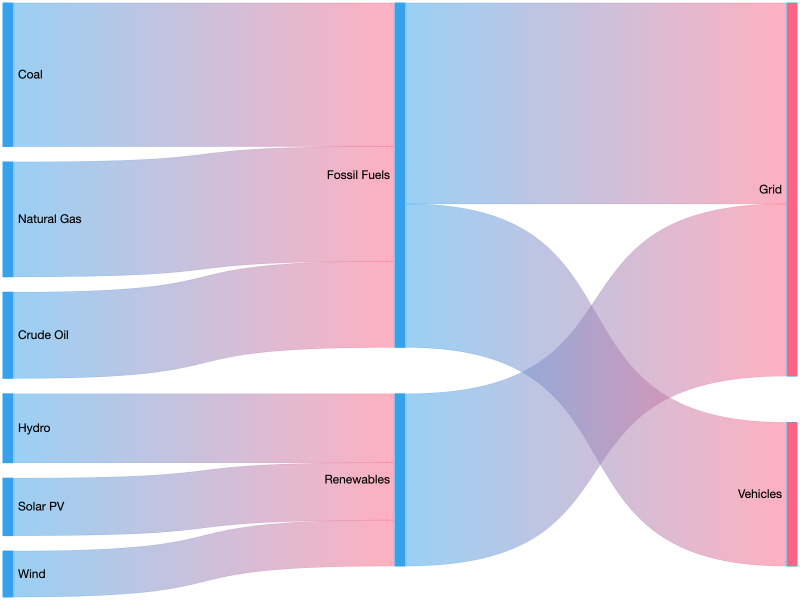
Sankey (chartjs-chart-sankey)
Flow between categorical nodes. flow is the width of each band.
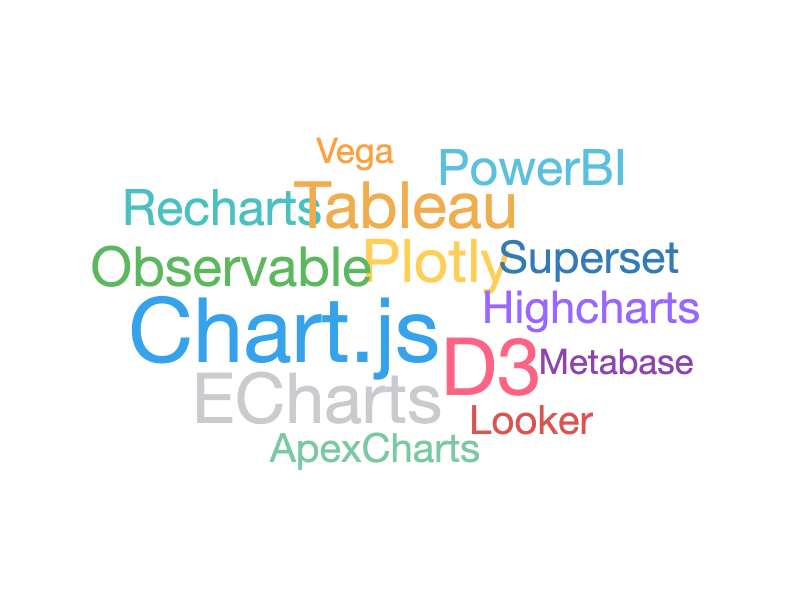
Word cloud (chartjs-chart-wordcloud)
Words come from data.labels, font sizes come from datasets[0].data.
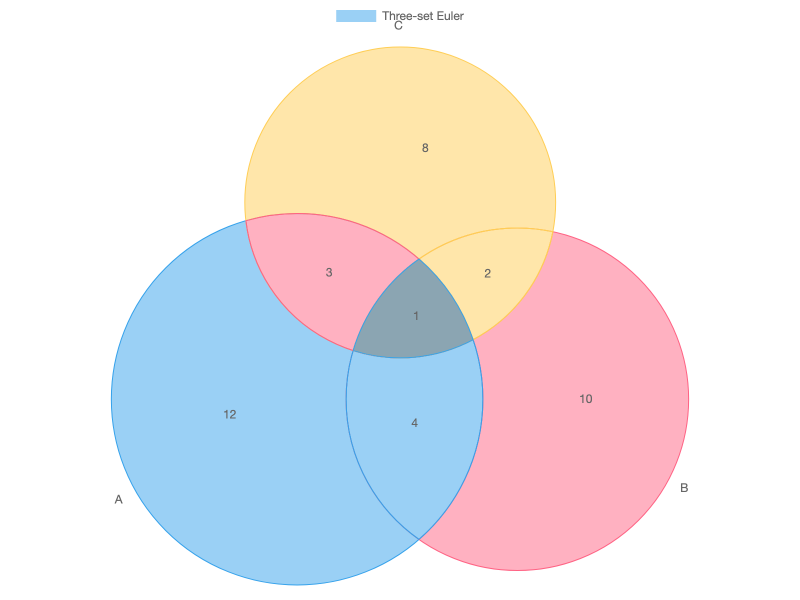
Venn / Euler (chartjs-chart-venn)
Set overlaps. Use "type": "venn" for a standard layout, "type": "euler" when circle sizes and overlaps should be proportional to values.
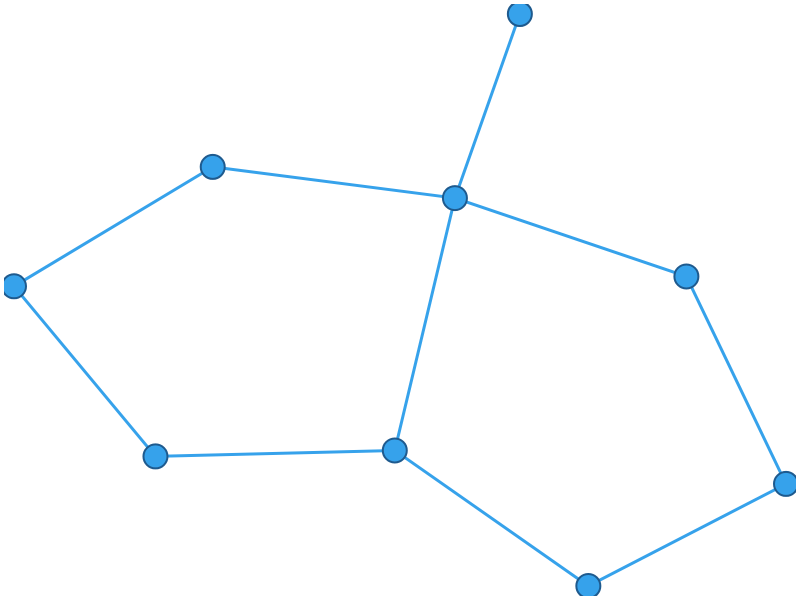
Force-directed graph (chartjs-chart-graph)
Network layout via physics simulation — no coordinates needed.
For a manual-layout graph instead (explicit {x,y} per node), use "type": "graph" and supply coordinates in data. The plugin docs cover the full option surface.
Tidy tree (chartjs-chart-graph)
Hierarchical layout driven by a parent index per node.
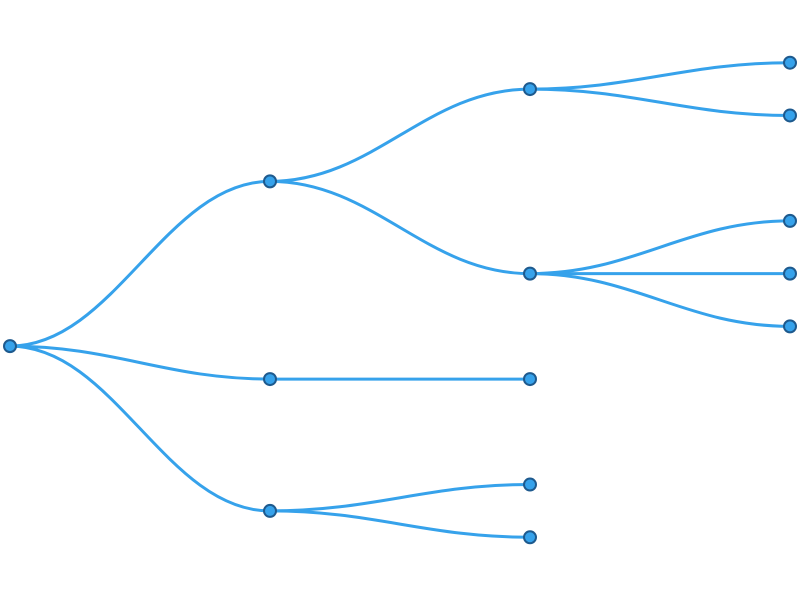
Switch to "type": "dendrogram" for a fixed-depth cluster layout, or set options.tree.orientation: "radial" for a circular tree.
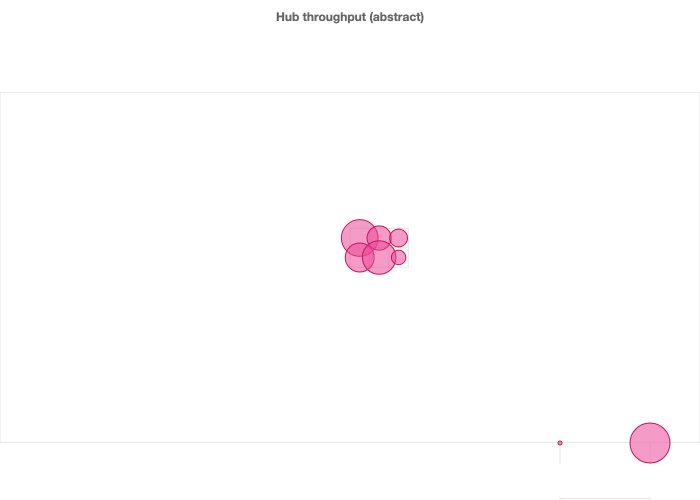
Bubble map (chartjs-chart-geo)
chartjs-chart-geo provides two chart types: bubbleMap (shown below) and choropleth. Both take a GeoJSON outline as the map bounds; bubble map then plots {longitude, latitude, value} points on top, sizing each bubble via the size scale.
This gallery example uses six hand-written polygon features in a 3 × 2 abstract grid so the config stays readable. For real maps, drop in a world / country FeatureCollection from Natural Earth or TopoJSON as the outline.
Key shape:
datasets[i].outline— array of GeoJSONFeatureobjects for the map bounds.datasets[i].data[i]—{ longitude, latitude, value }.valuedrives bubble radius viaoptions.scales.size.size: [min, max].options.scales.projection— any d3-geo projection name (e.g."equirectangular","equalEarth","mercator").
For choropleth, keep the same outline / projection config and pass { feature, value } points — each feature's interior gets colored by value, driven by an options.scales.color scale.
Payload tip: Real-world TopoJSON is often several hundred KB. If you're driving chartjs2img from an HTTP client, POST the config rather than using
GET /render?chart=…— query-string limits bite long before the JSON body does.
Why not every exotic type?
The gallery stays small on purpose so visual regressions are easy to eyeball. The rendered examples above cover the primary layout styles each plugin provides; every other exotic variant is exercised by chartjs2img llm's canonical example (agents read those automatically) and by the JSON snippets above. To preview any of them with your own data, paste the snippet into chartjs2img render -i <file> -o out.png.