Basic chart types
The nine built-in Chart.js types. Every one of these works out of the box with type: "…" — no plugins required. Switch between the rendered PNG and the source JSON with the tabs on each example.
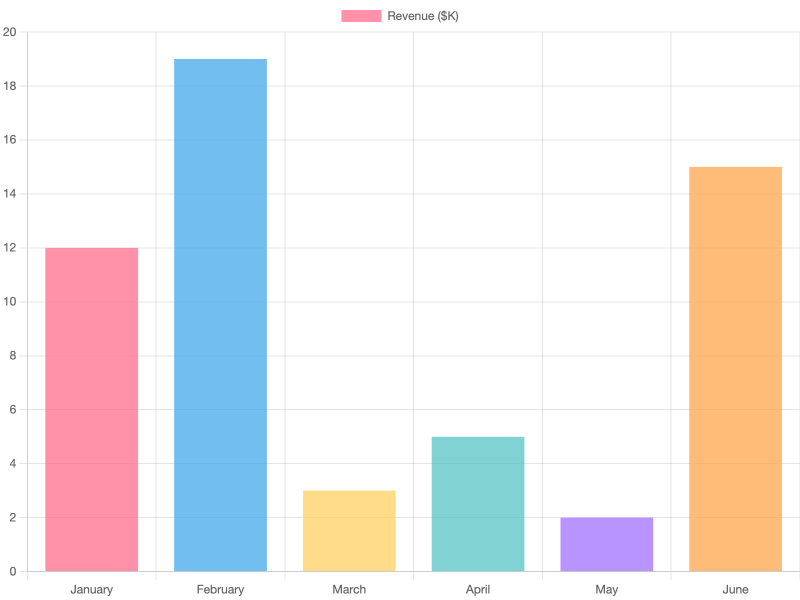
Bar chart
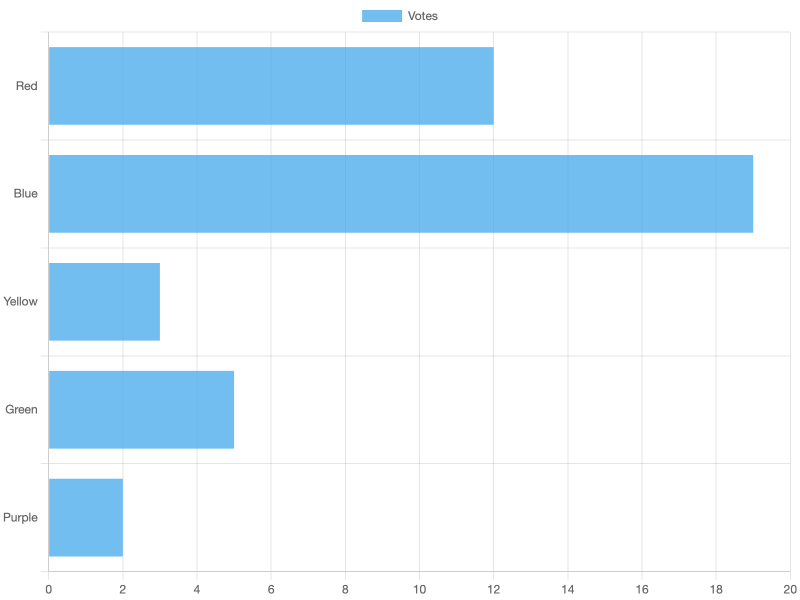
Horizontal bar chart
Same type: "bar" with options.indexAxis: "y".
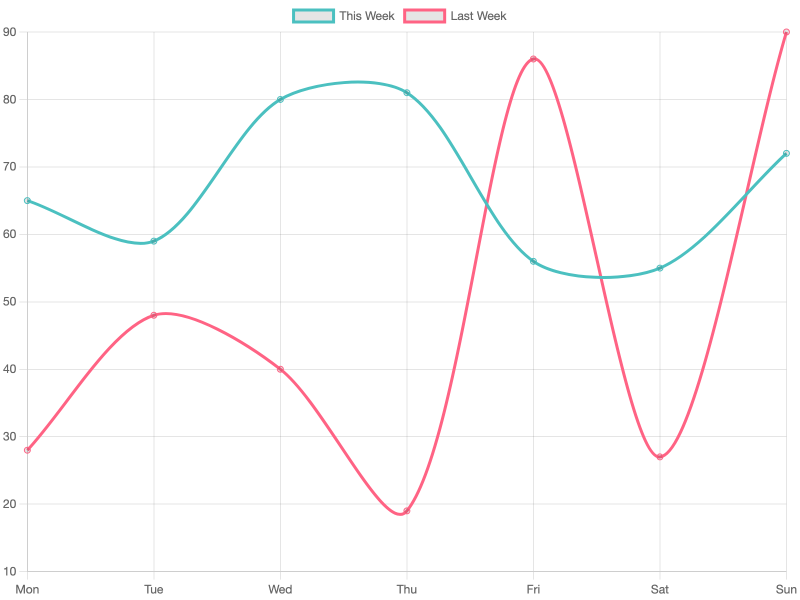
Line chart
Multi-dataset with tension: 0.3 for smooth lines.
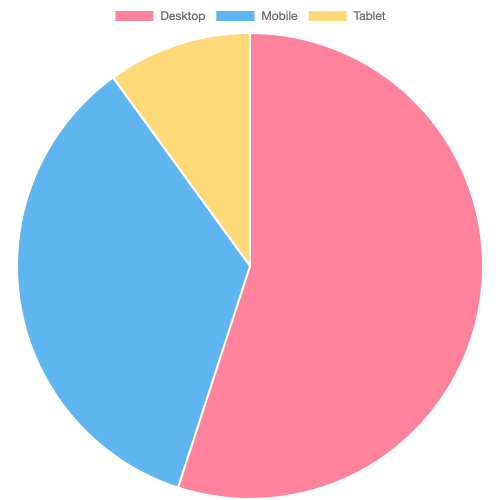
Pie chart
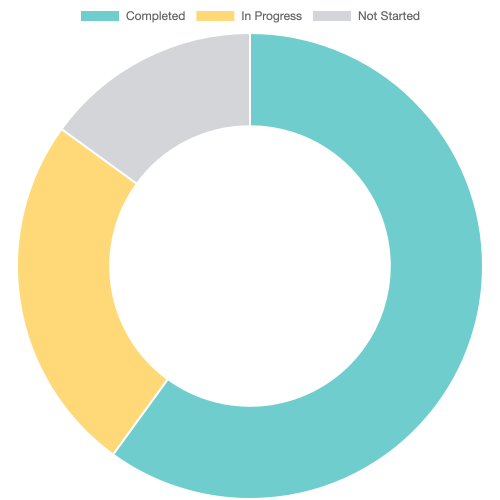
Doughnut chart
Identical to pie + chart.type: "doughnut".
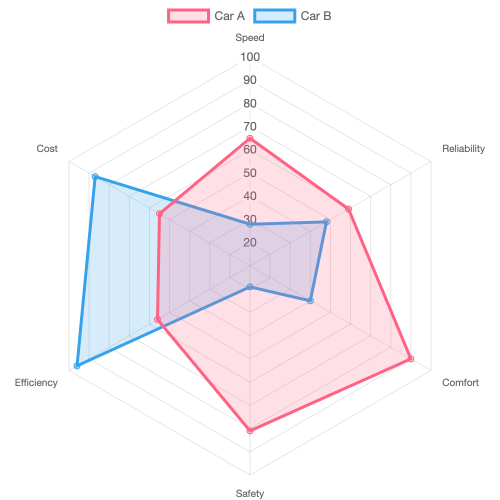
Radar chart
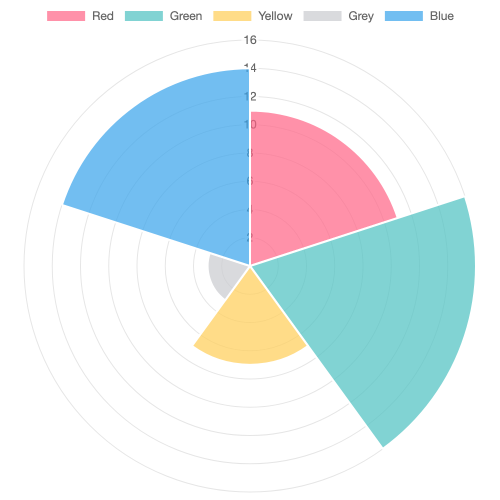
Polar area chart
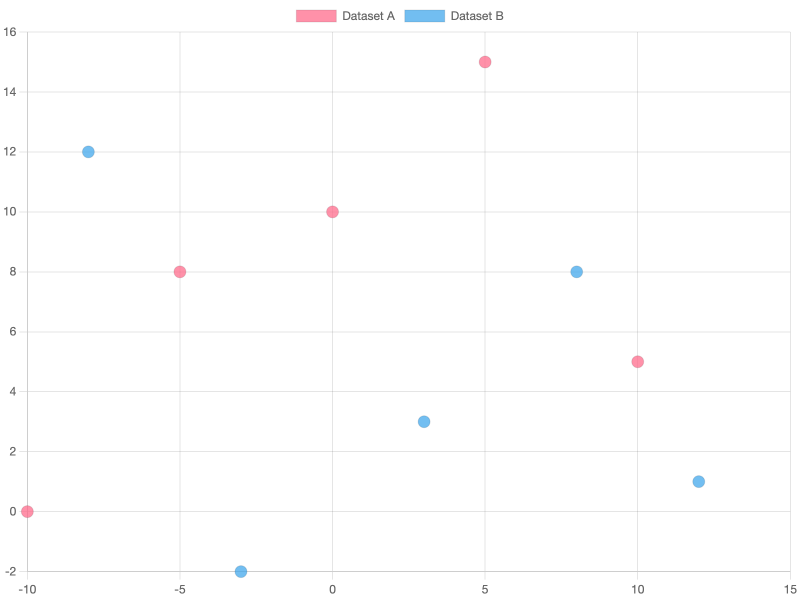
Scatter plot
Datasets take {x,y} objects rather than values.
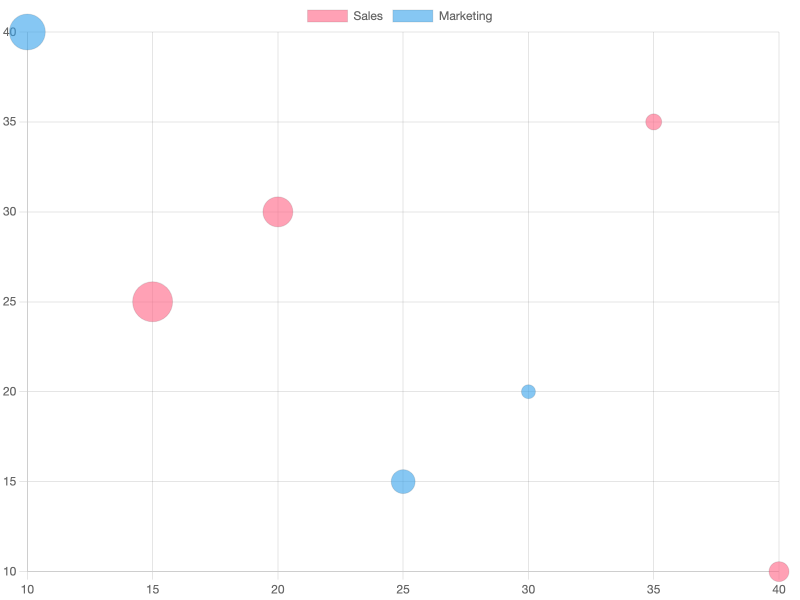
Bubble chart
Scatter but with radius (r) per point.
Next
- Composite charts — filled area, stacked, mixed-type.
- Labels & annotation — data labels and threshold lines.
- Exotic plugins — treemap and beyond.