Labels & annotation
Decorator plugins — the chart shape is ordinary, but something is drawn on top of it (or applied as a fill).
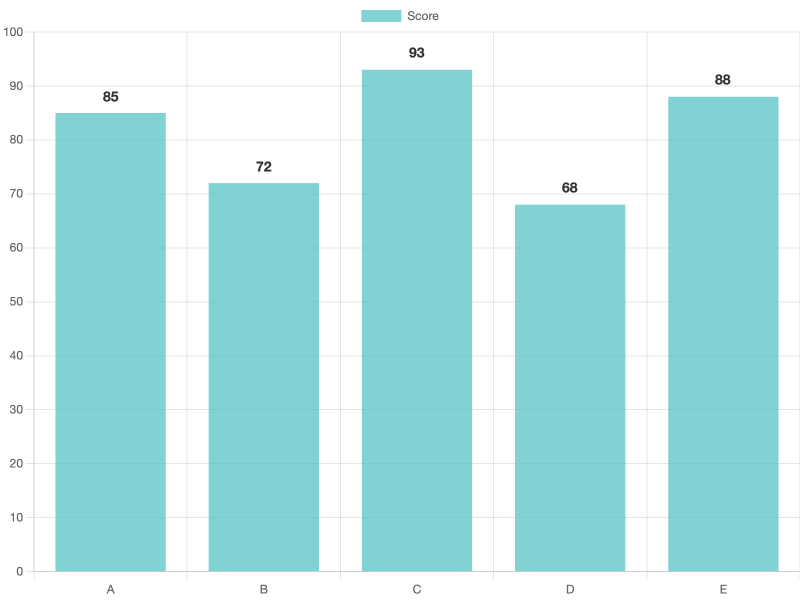
Bar with data labels (chartjs-plugin-datalabels)
Uses chartjs-plugin-datalabels. Note the explicit options.plugins.datalabels.display: true — datalabels is off by default in chartjs2img (opposite of the plugin's own default).
datalabels options recap
| Option | Typical values | Effect |
|---|---|---|
display | true / false / "auto" | Show labels (required — see above) |
anchor | "start" / "center" / "end" | Where on the element the label is anchored |
align | "top" / "bottom" / "center" / number (degrees) | Direction from anchor |
color | CSS color | Text color |
formatter | function | Not usable over JSON — see Developer Guide |
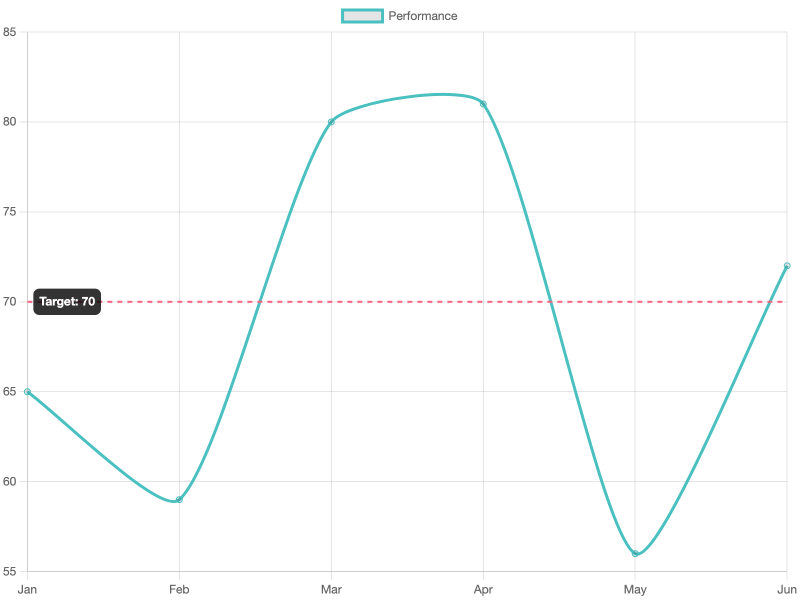
Line with annotation (chartjs-plugin-annotation)
Uses chartjs-plugin-annotation. Here a horizontal threshold line.
Annotation types you can use
"line"— horizontal / vertical / diagonal line (what's shown above)"box"— filled rectangle"label"— standalone text"point"— small circle"polygon"— custom shape"ellipse"— filled ellipse
Box + point annotations combined
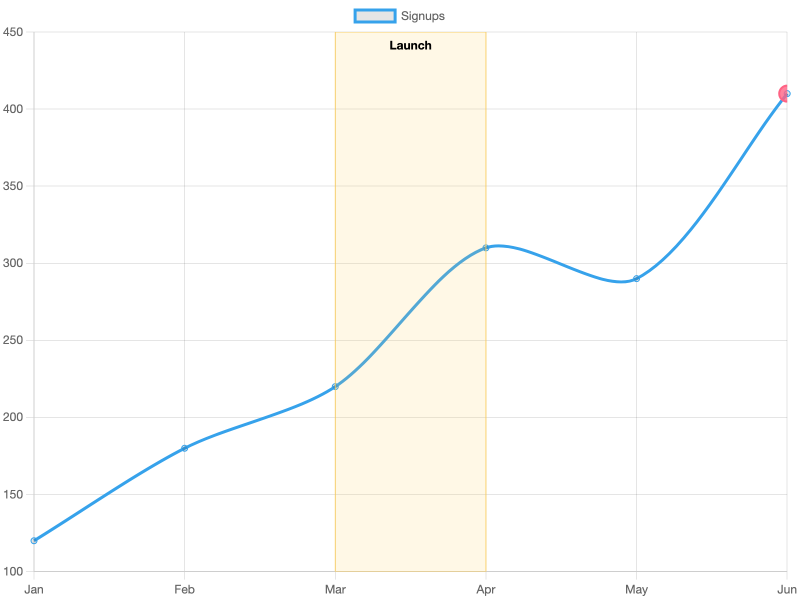
See the plugin docs or chartjs2img llm for all options.
Gradient fills (chartjs-plugin-gradient)
Map scale values to colors and the plugin interpolates along an axis — no manual canvas code required.
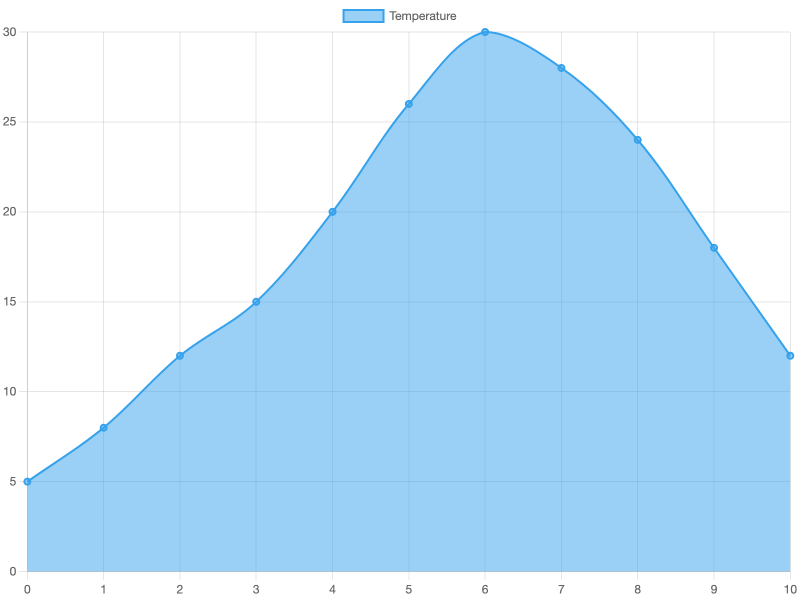
Keys in colors are scale values, not pixel positions — so a gradient that transitions at y = 15 stays correct even if the chart is resized. Works with line, bar, radar, polarArea, and any chart using backgroundColor / borderColor.
Zoom framing (chartjs-plugin-zoom)
chartjs2img renders static images, so the interactive pan/zoom of this plugin doesn't apply — but the plugin's options.plugins.zoom.limits is still useful for clamping the initial visible range of a crowded chart.
{
  "type": "line",
  "data": {
    "labels": ["1","2","3","4","5","6","7","8","9","10","11","12","13","14","15","16","17","18","19","20"],
    "datasets": [{
      "label": "Noisy series",
      "data": [5, 12, 8, 20, 18, 25, 30, 22, 28, 34, 40, 38, 45, 50, 48, 55, 60, 58, 65, 70],
      "borderColor": "#36a2eb",
      "tension": 0.25
    }]
  },
  "options": {
    "plugins": {
      "zoom": {
        "limits": {
          "x": { "min": 4, "max": 14 },
          "y": { "min": 15, "max": 50 }
        }
      }
    },
    "scales": {
      "x": { "min": 4, "max": 14 },
      "y": { "min": 15, "max": 50 }
    }
  }
}
For static rendering you typically set scales.x.min/max and scales.y.min/max directly; the zoom plugin simply enforces those bounds globally if downstream code ever needs them.
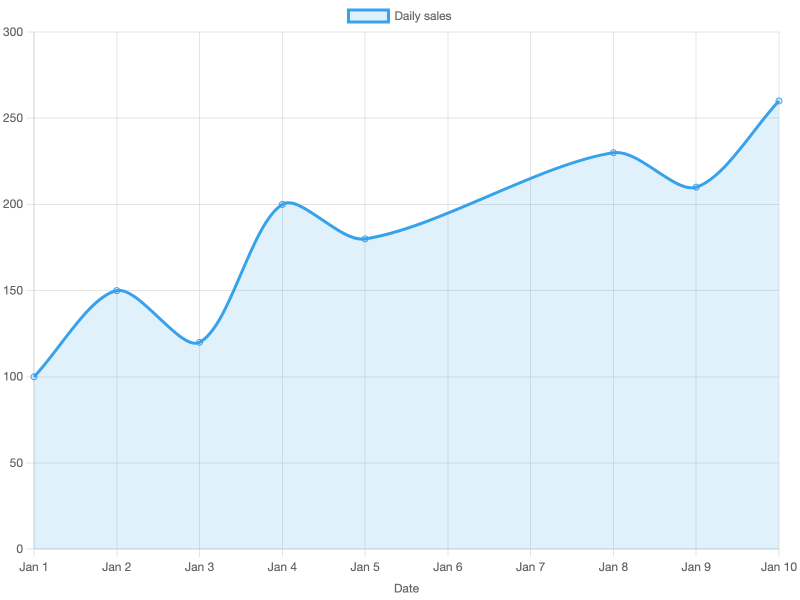
Time-series axis (chartjs-adapter-date-fns)
The date-fns adapter is pre-loaded — set scales.x.type: "time" to enable it. Input dates can be ISO strings, millisecond timestamps, or anything date-fns can parse.
Format tokens: date-fns uses
yyyy/d(not Day.js'sYYYY/D). If Chart.js throwsUse \d` instead of `D``, swap the tokens.
See the date-fns adapter or chartjs2img llm for every time.* option.